
Successful measures
 Survival in the midst of an economic downturn requires extraordinary measures...and some fairly basic principles. Hospitals need to assess all their options and get the best out of all their departments, including clinical engineering (CE).
It's important to know the primary measures for the CE department and how to use benchmarking as a low-cost way to assess and improve its performance. The same assessment techniques that are used to evaluate in-house CE departments can also be applied when CE services are delivered contractually by an independent service organization (ISO).
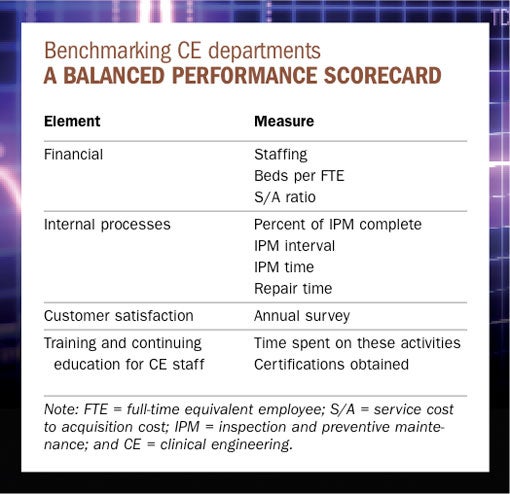
Benchmarking is assigning numbers to specific activities and comparing those numbers to reference values when evaluating the activities' performance. Although hospital administrators tend to focus primarily on financial measures—such as the total value of the CE department budget—business literature has established that the best way to benchmark an organization is through the development of a balanced scorecard. Such a balanced scorecard method includes measures of financial performance as well as measures of internal processes, customer satisfaction and education. Only a few indicators are used for each area.
Thus, to use the balanced scorecard approach in assessing the performance of the CE department, health facilities professionals must focus on the measures of inspection, preventive maintenance and repair because these three activities usually consume about 80 percent of a CE department's labor. Other significant CE activities include managing equipment hazards and recalls, service contracts and special projects, training and meeting with clinical staff, supporting the purchase process and administrative work.
Benchmarking in context
Administrators focus much attention on staffing and financial performance, so it's critical for health facilities professionals to understand those areas well.
Staffing seems straightforward, but presenting the staffing numbers in the right context isn't. In fact, providing the proper context is the main challenge when benchmarking any performance parameter. The main contextual elements for staffing are the ratio of beds to full-time equivalent (FTE) employees, activities other than inspection and preventive maintenance (IPM) and repair, and the amount of equipment under service contract.
Much industry literature uses a simple average of beds per FTE, such as 40 beds/FTE. However, health facilities professionals should be cautious about such data. Research derived from Plymouth Meeting, Pa.-based ECRI Institute shows that a simple average is misleading. Professionals need to look at the data that corresponds to the bed size of the hospital. ECRI conducted first-hand research based on data obtained from 73 hospitals in 2008 to help determine staff benchmarking recommendations. From looking at eight different bed size ranges in 100-bed increments from less than 100 beds up to 800 beds, the bed/FTE ratio ranged broadly from 18 to 49.
A significant amount of CE department time may be spent on activities other than IPM and repair. For hospitals with 201 to 300 beds, the survey found that about 0.5 FTE was spent on other activities such as service contract support, wireless support and activities with the information technology department. Consequently, if a CE department's beds/FTE ratio differs significantly from its peers, it may be due to the time spent on activities that may not be required in other hospitals.
The amount of equipment that is maintained under service contract is another important contextual element to interpreting staffing numbers. When hospitals hire outside organizations to maintain equipment, they should theoretically reduce the time spent performing those activities. Logically, the more equipment under service contract, the fewer CE department staff required to maintain it. Thus, when looking at staffing numbers, professionals should be sure to know how much equipment is under contract and how that compares to same-sized institutions.
The ECRI survey also found that the majority of 201- to 300-bed hospitals had less than 25 percent of their general biomedical equipment such as ventilators, physiologic monitors and infusion pumps under service contract; 50 percent or less of their clinical laboratory equipment under contract; and more than half of their imaging equipment under contract. If a health facilities professional manages the CE department of a 250-bed hospital and takes care of all of the imaging equipment, he or she would be expected to require more staff than another 250-bed hospital that outsources imaging equipment maintenance.
Common financial measures
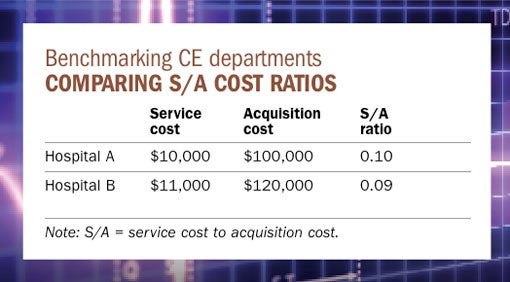
The most common financial performance metric is the service cost to acquisition cost (S/A) ratio. This is the ratio of the total cost to deliver a service, including parts and labor, divided by the acquisition cost of the equipment.
When the service is delivered by a manufacturer or third-party ISO, the service cost is usually the cost of a full service contract that includes IPM and repair. When the service is delivered by the in-house CE department, the service cost is determined from the amount spent on parts and CE labor (labor hours) multiplied by the "loaded" rate including salary, benefits and other overhead expenses. Generally, service provided by the original equipment manufacturer (OEM) is the most expensive. Service provided by an ISO is typically 20 percent less than OEM services and in-house service often costs 50 percent less than the amount of a full-service OEM contract.
The S/A ratio varies by equipment category. Imaging and high-tech laboratory equipment has a higher S/A ratio and is thus more costly to maintain than general biomedical equipment. It may also vary due to institutional differences (see table below). For example, some CE departments at teaching institutions in urban locations claim that they have higher overhead rates than rural community hospitals of the same relative size. Likewise, CE departments in hospitals that have negotiated low purchase prices will be penalized with higher S/A ratios.
As a result of such discrepancies, some members of the CE community have asked for a reference price database for all types of equipment that could be used as a common denominator. Health system members may want to contact their central administrative office to see if their organization is collecting S/A information for medical equipment that could be used for this purpose. Likewise, ECRI provides average service contract cost, S/A ratio and acquisition cost for more than 630 categories of medical equipment and provides model-specific pricing for all medical products. This information comes from ECRI's databases, which are built from information provided by its members and updated daily.
Equipment level performance
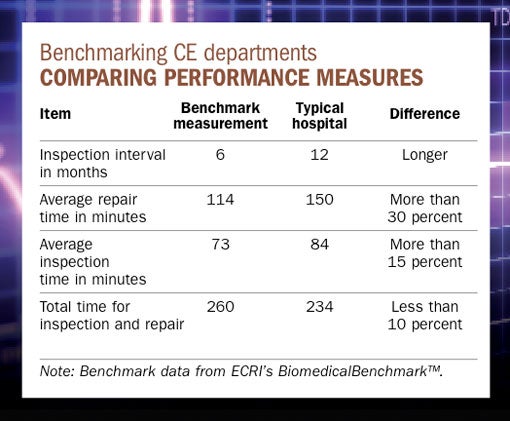
Benchmarking equipment maintenance is less ambiguous than evaluating the financial performance. The main measures are percent of IPM complete, IPM interval, IPM time and repair time. Health facilities professionals should focus on the technologies that take up the majority of staff labor. They often include anesthesia machines, beds, blood warmers, compression units, defibrillators, electrosurgical units, infant warmers, infusion pumps, physiologic monitors and ventilators. Some facilities also support a significant amount of non-patient care equipment, including office equipment such as PCs, fax machines and printers; patient entertainment system televisions and television screens; security systems; and telecommunication systems.
When hospital data is compared with benchmark values, it is obvious that extending the maintenance interval saves labor costs. Moreover, some hospitals might not know that The Joint Commission allows inspection intervals to be adjusted based on risk and hospital maintenance data and, thus, the hospital doesn't have to default to manufacturer recommendations. And, if hospitals are spending more than the average time on repairs, there may be an opportunity for further savings.
CE departments spend most of their time maintaining and repairing equipment so it is critical to benchmark the delivery of those services while not forgetting other very important services such as hazard and recall management, patient safety activities, acquisition support and other support services. Most CE departments could save about one-third of the labor they spend on preventive maintenance (PM) by lengthening the intervals for some equipment, eliminating PM for other equipment and changing PM procedures to eliminate unnecessary activities.
Areas for improvement
Health facilities professionals should develop and understand a few benchmarking measures and use information from their organizations and other sources to identify areas for improvement. Benchmarking won't solve all problems, but it is an effective blunt instrument to show where to focus attention.
Jonathan Gaev is business line manager for BiomedicalBenchmark™ at ECRI Institute, Plymouth Meeting, Pa. BiomedicalBenchmark™ provides detailed information on staffing, cost, repairs and maintenance to the clinical engineering community. Gaev can be reached at jgaev@ecri.org.
| Sidebar - CE department activity definitions |
| ECRI Institute, Plymouth Meeting, Pa., provides a set of technology service definitions for clinical engineering (CE) department activities at www.ecri.org/umtsn. Following are the major ones:
|
| Sidebar - Finding the right measure |
| Many members of the clinical engineering community have strong concerns about comparing staffing levels in their facilities to others. Many feel that bed size alone is too simplistic a measure and that a true comparison would require taking into consideration the hospital's inventory, teaching status and whether it is rural or urban. However, bed size is a good predictor of staffing as is the number of admissions (considering outpatients in the equation does not produce better predictions, according to data from ECRI Institute, Plymouth Meeting, Pa.). Although inventory is also a good predictor of staffing, it is hard to use as a benchmark since there is no standard way to count devices. When using inventory numbers, health facilities professionals must be sure they are comparing their operation with another hospital that has the same bed size and that counts inventory in the same way. For example, some hospitals count beds as medical devices and some don't. Similarly, some will count a physiologic monitor as one device and another will also count its modules, increasing the number of devices. More staff are required to service equipment that breaks more frequently but some research shows that increased failures are not associated with higher occupancy rates, discharges, lengths of stay or teaching status of the hospital. These questions will be revisited as the industry continues to collect information about equipment failures. |
Related Articles

ASHRAE guidelines and standards open for comment
A list of ASHRAE addenda, revisions and drafts affecting health care open for public comment.

Defining existing building commissioning
Health care facilities can use existing building commissioning to accomplish much more than just energy savings.
Preventing a possible outbreak through emergency response and remediation
Lessons learned from a real-life hospital flooding scenario and six steps for response.