
The ambulatory shift: the need for better benchmarking
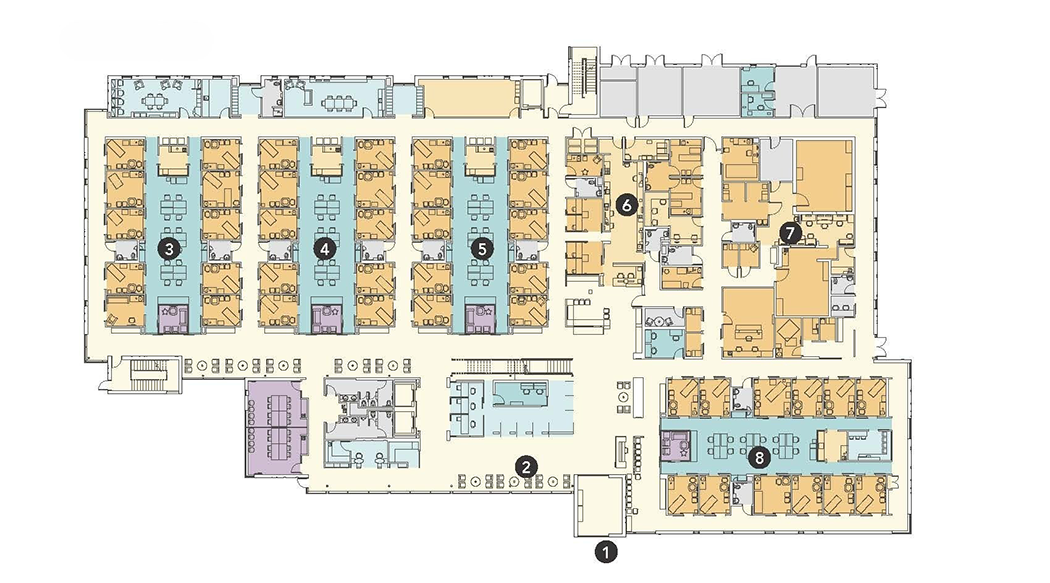
Figure 1: AIA/AAH Research Initiatives Committee members used the layouts of award-winning outpatient clinic projects as part of a benchmarking project. The above layout depicts the Everett Clinic, Smokey Point Medical Center, winner of the 2013 AIA Healthcare Design Award.
Image courtesy of ZGF
The United States health care field continues to undergo a dramatic shift toward outpatient care. Providers are under pressure to meet demand with new facilities and to be competitive in a dynamic market by leveraging opportunities to improve care delivery and the patient/consumer experience. Design teams have been responding to this drive to improve quality and efficiency and elevate the patient/consumer experience with new, innovative outpatient clinic typologies. However, with the financial squeeze of rising construction costs and shrinking reimbursement rates, there is a need to manage capital costs while still exploring new solutions. This puts pressure on design teams to prove the value of their concepts. Reliable benchmarking metrics are a key element in the designer’s toolkit, and a consistent methodology for area takeoffs is part of that reliability.
In its work on the American Institute of Architects/Academy of Architecture for Health’s (AIA/AAH’s) Case Study Library, the AIA/AAH Research Initiatives Committee has seen an increase in award-winning outpatient clinic projects (see Figure 1 above). In developing case studies for these projects, the committee also identified the lack of a clear, consistent methodology for comparing the planning metrics and benchmarks of traditional clinic typologies with newer typologies.
In 2021, the AIA/AAH Research Initiatives Committee formed a benchmarking metrics subcommittee to explore this topic using clinic floor plans available in the case study library. For the past four years, the subcommittee has been studying what the implications are of this ambulatory care facility shift on net-to-gross ratios in various clinic typologies, as well as the implications this shift will have on the design decisions of providers and their design teams. The goal has been to develop a methodology that is consistent with the “Analysis of Departmental Area in Contemporary Hospitals: Calculation Methodologies & Design Factors in Major Patient Care Departments,” (David Allison and Kirk Hamilton 2008), which has been the industry standard for benchmarking hospital planning for nearly two decades.
Using outpatient clinic projects from the AIA/AAH Case Study Library built in the past 10 years, and with feedback from several years of roundtable evaluation by peers in the design industry, the benchmarking metrics subcommittee has developed and piloted analytical tools and standards to assist design professionals and owners as the health care field moves into a new world of wider use of ambulatory environments in new and varied building types.
To date, the subcommittee has analyzed distinct circulation patterns, care team arrangements, waiting areas and circulation, and repeatable, scalable layouts. The findings informed the development of protocols for the consistent evaluation of clinic efficiency where no standard currently exists. This approach supports design teams in making data-driven decisions, facilitates consistent benchmarking across projects and guides the planning of adaptable, high-performance ambulatory environments.
Evaluating care team typologies
Among the case study outpatient clinic projects, the committee recognized a wide range of specialty and ancillary program elements that would make it difficult to compare projects if benchmarking metrics were based on the entire building. Since exam rooms are the primary key planning units in a clinic setting, we focused on the idea of benchmarking a single clinic “pod” from each project.

Figure 2 Click image to expand
The clinic “pod” (see figure 2 above) is defined as a separate, unique unit of space within a plan that contains a set number of exam rooms that are served by their own care team and adjacent ancillary spaces.
While the ancillary spaces are occasionally shared between pods, the pod can generally function as a fully complete unit that can be repeated indefinitely for as large or small a building as is necessary.

Figure 3 Click image to expand
Once the concept of the pod was in place, the committee dove deeper to understand how to further make these numbers easily comparable in an apples-to-apples approach. The first concept the committee identified is that the circulation in outpatient spaces does not always follow the same logic as that of a hospital. Onstage/offstage clinics where two doors lead into the exam room — one from a staff team area side and another from a public corridor off a waiting area — led to the rise of distinctly separate corridors for patients and staff (see figure 3 to the right). The committee initially saw this as an opportunity to classify the pods into two separate types: mixed circulation (where both patients and staff ambulate through the same corridor) and on stage/offstage. While this worked in theory, trouble arose when the designs of some mixed circulation pods varied greatly from one another.
After re-examining the clinics, we noticed that the real relationship driving the size and shape of each of these pods was more about the location of the care team in relation to the exam rooms than it was about circulation. Once this concept was in place, it was simple to identify pod typologies by care team strategy. Onstage/offstage care team typology occurs when the care team is completely separate from patient circulation. Central care teams are located directly adjacent to the shared corridor for maximum visibility of patient traffic and rooms. And linear care teams are located within the treatment space lineup, providing visibility to patient spaces and some privacy to the care team area (see figure 4 below).
Figure 4 Click image to expand
Defining the methodology
While much of the standard hospital takeoff methodology (Allison and Hamilton 2008) can apply similarly to clinics, there are a few key differences between a clinic environment and a hospital environment that required judgment calls and additional protocols to be added to the methodology. For example, because the study involves only clinic pods, each pod is treated as a separate department. This requires that only half of the perimeter corridor is included when it also serves an adjacent pod. Another judgment call that the subcommittee made, specifically for onstage/offstage pods, is the treatment of circulation space within the care team area. Is it part of the workspace or is it circulation? As a result of a significant amount of attention within the subcommittee and discussion at conference roundtables, the methodology considers it as circulation and does not count it toward the net square feet (NSF) for the clinic pod (see figure 3 above). The reasoning behind this is that these are required circulation spaces for staff to access the exam room doors.
The definitions and methodologies for NSF, departmental gross square feet (DGSF), and the common building elements that are excluded from DGSF — such as corridors used for intradepartmental circulation; mechanical, electrical, plumbing and technology (MEPT) spaces required specifically for building function; and vertical circulation — are identical to the hospital takeoff methodology (Allison and Hamilton 2008), but definitions have been renamed in the AIA/AAH research project to apply specifically to pods. These include:
- Pod gross square feet (PGSF). This calculation includes three factors: half of the hallway width in facilities where hallways are shared with functions outside the specified pod; the designated waiting area (defined as the total gross square feet (GSF) of the waiting area divided by the number of pods); and all areas within the pod itself, including walls, but excluding any unique building support rooms that fall within the pod, such as MEPT and structural column/beam space.
- Pod net square feet (PNSF). This calculation includes the usable square footage of all rooms and waiting areas, excluding circulation and unique building support rooms that fall within the pod.
- Pod grossing factor. This calculation divides the PGSF by the PNSF to provide a grossing factor based on accepted industry standard grossing factors.
- Pod total usable net square feet. This calculation is the PNSF number with the net circulation included.
Waiting and circulation
Multipliers for waiting, registration and circulation spaces in clinic projects can vary significantly depending on the clinic’s size, specialties and care model. From a resource allocation perspective, waiting and registration areas may follow either decentralized or centralized typologies. In modern clinic designs, the three public functions of waiting, registration and circulation are often integrated, which makes accurately determining the square footage of each component challenging.
To analyze waiting and circulation areas in the case studies, a two-step method was applied.
First, the spatial layout was reviewed to classify each space as either an enclosed waiting room or an irregularly shaped, semi-enclosed or open-plan area. For enclosed waiting rooms, the entire room’s square footage was assigned to the waiting category. For irregular or open-plan layouts, the circulation space was deducted from the total, yielding separate figures for waiting and circulation. In open-plan waiting areas, circulation paths were defined with widths consistent with other clinic corridors or aligned with major spatial elements, such as walls, columns or fixed furniture. A minimum width of 6 feet was maintained in accordance with building codes. Door-to-door connections were established with adequate clearance, and the total area of these circulation paths was subtracted from the open-plan public space to determine the net waiting area. For reception/registration desks, an additional 10-foot clearance was allocated to the registration area to accommodate patient queuing.

Figure 5 Click image to expand
The above three examples in figure 5 illustrate how the waiting and circulation areas were measured using our protocol:
- Scenario 1 – waiting room. The entire enclosed waiting room is measured and counted as the waiting area.
- Scenario 2 – open, regular layout. The waiting area boundary is aligned with walls and major furniture, and circulation paths are assigned widths equivalent to other corridors in the clinic.
- Scenario 3 – open, irregular layout. Boundaries are aligned with walls and major furniture, and circulation paths are defined as door-to-door connections that meet the minimum corridor width requirement. The area of these circulation paths is then subtracted from the total open-plan space to determine the net waiting area.
A range of waiting multipliers can be studied for benchmarking purposes across projects, such as the waiting-to-pod area ratio and the waiting-to-total usable floor area ratio. Consistency is essential; using either GSF or NSF consistently across all case studies ensures reliable benchmarking results. The study also will introduce a new objective multiplier: the total waiting area divided by the minimum personal space requirement. This will allow designers to evaluate the maximum capacity of the waiting area while excluding the influence of furniture style, arrangement and similar factors.
Feedback from the field
Beyond the work of the internal subcommittee volunteers, the larger committee has engaged the expertise of health care designers through Benchmarking Roundtable discussions that have taken place at the Healthcare Design Conferences from 2021 to 2025. The roundtables have been very useful in collecting practitioner feedback for the development of tools and standards. While the committee started this project with the recognized protocols for hospital net-to-gross takeoffs (Allison and Hamilton 2008), the roundtables provided important feedback on the similarities and differences of clinics versus hospital takeoff strategies. The yearly roundtable format has steered the methodology of this project, particularly on care team typology classifications, reinforcement and pertinence of metrics per key room, support for room-labeling consistency and the endorsement of shared circulation and waiting area takeoff strategies.
Future thinking
As health care providers and design firms become more analytic in their decision-making, the AIA/AAH Research Initiatives Committee has created a methodology for tracking comparative metrics among the ever-changing shifts in ambulatory building typologies. By applying our methodology to case studies of AIA Healthcare Design Award-winning outpatient clinic projects and publishing them in the AIA/AAH Case Study Library (see related article below to access the library), the committee’s goal is to provide inspiration to all firms, thus raising the bar of future ambulatory care and clinic design.
Related article // AIA/AAH Case Study Library: Benchmarking health care design
The American Institute of Architects/Academy of Architecture for Health (AIA/AAH) Case Study Library (see link below) is a rich resource of comparative planning metrics from AIA award-winning health care projects, available for free.
Case studies are developed from projects that have received the annual AIA Healthcare Design Award. The Case Study Library has been published online continually since 2016 by the AIA/AAH Research Initiatives Committee and is updated each year with the latest design awards with the goal of “bridging the gap” between research and practice.
Based on industry-standard methodology established by the 2008 research “Analysis of Departmental Area in Contemporary Hospitals: Calculation Methodologies & Design Factors in Major Patient Care Departments” by David Allison and Kirk Hamilton, the library now includes case studies of award-winning hospital projects and a growing number of ambulatory clinic projects that include data on spatial layout, net-to-gross square footage ratios, departmental adjacencies, key room counts and other operational-design metrics using a standardized format that was developed by the Clemson University Architecture + Health program at the Richard A. McMahan School of Architecture for its graduate studio projects and generously shared with the AAH. Since its inception, the Research Initiatives Committee has worked with the support of the Clemson Architecture + Health program to refine the standardized case study format.
The committee’s methodologies for analysis have been presented regularly for discussion at Research Forums and Benchmarking Roundtables at the Healthcare Design Conference over the past decade, where it has received valuable feedback from industry. The library is updated and maintained by the AIA/AAH Research Initiatives Committee with generous assistance of graduate students from the health care architecture programs at Clemson University, Georgia Institute of Technology SimTigrate Design Center and University of Florida School of Architecture City-Lab Orlando.
The complete case study library is available for download here: AIA/AAH Case Study Library.
About this article
This feature is one of a series of articles published by Health Facilities Management in collaboration with the American College of Healthcare Architects.
Ron Smith, AIA, ACHA, ACHE, LEED AP, is director of medical planning at LS3P in Raleigh, N.C., and Patrick Leahy, AIA, ACHA, ACHE, EDAC, LEED AP, is principal architect and director of health care planning at Emergent Architecture in Omaha, Neb. They can be reached at ronsmith@ls3p.com and patrick@emergentarch.com.
The following American Institute of Architects/Academy of Architecture for Health’s Research Initiatives benchmarking metrics subcommittee members contributed to this article.
- Marjorie Eliason Brown, AIA, NCARB, LEED AP, is president of Eliason & Brown in Portland, Ore. | eliason@comcast.net
- Shan Jiang, Ph.D., is an associate principal and director of research at GBBN in Pittsburgh. | sjiang@gbbn.com
- Mary Beth Welty is a health care planner and associate at ZGF in Portland, Ore. | marybeth.welty@zgf.com
- Molly Storrs, AIA, NCARB, EDAC, LEED AP BD+C, is principal and founder of Storrs Design Studio in Seattle. | molly@storrsdesignstudio.com
- Zahra Daneshvar is an interior designer at GBBN in Pittsburgh. | zdaneshvar@gbbn.com.
Related Articles
The facilities manager’s role in reducing healthcare-associated infections
From multidisciplinary communication to establishing safety procedures for construction, remediation and maintenance, facilities teams play a critical hand in reducing patient infections.

Intentional design, seamless care
Thoughtful wayfinding cues and a cohesive aesthetic enable smooth transitions between Endeavor Health Cardiovascular Institute's distinct occupancies.

Working with 'dual-vantage' architects
Certified design expertise aligned with the nuances of health care facilities management bridges the gap between architectural vision and daily operations.