
Measuring TJC surveyor consistency

Variations in surveyor scoring were recently studied in a project by The Joint Commission.
Image by Getty Images
Consistency is one of the hallmarks of a highly reliable organization, regardless of whether that organization is in aviation, manufacturing, nuclear power or health care. Policies and protocols must be developed, rigorous training and competency testing must be conducted, and monitoring systems must be implemented to ensure that processes occur as anticipated and the desired outcomes are achieved.
The Joint Commission (TJC) believes all health care organizations should work to become more highly reliable. But what about TJC’s own accreditation survey and certification review processes?
TJC has always had well-established policies and protocols, and it rigorously trains surveyors, including classroom time, online learning, real-world experience and mentorship on surveys. However, until recently, TJC had limited ability to track variations in surveyor scoring, which hampered its efforts to improve consistency.
The SAFER matrix
When TJC developed the Survey Analysis for Evaluating Risk (SAFER) matrix™ in 2017, the need to develop ways to ensure consistency became even more important. This scoring method goes beyond identifying a problem with standards compliance and allows surveyors to classify the scope (i.e., how widespread the problem is) and risk (i.e., how likely it is to cause harm) of the deficiency.
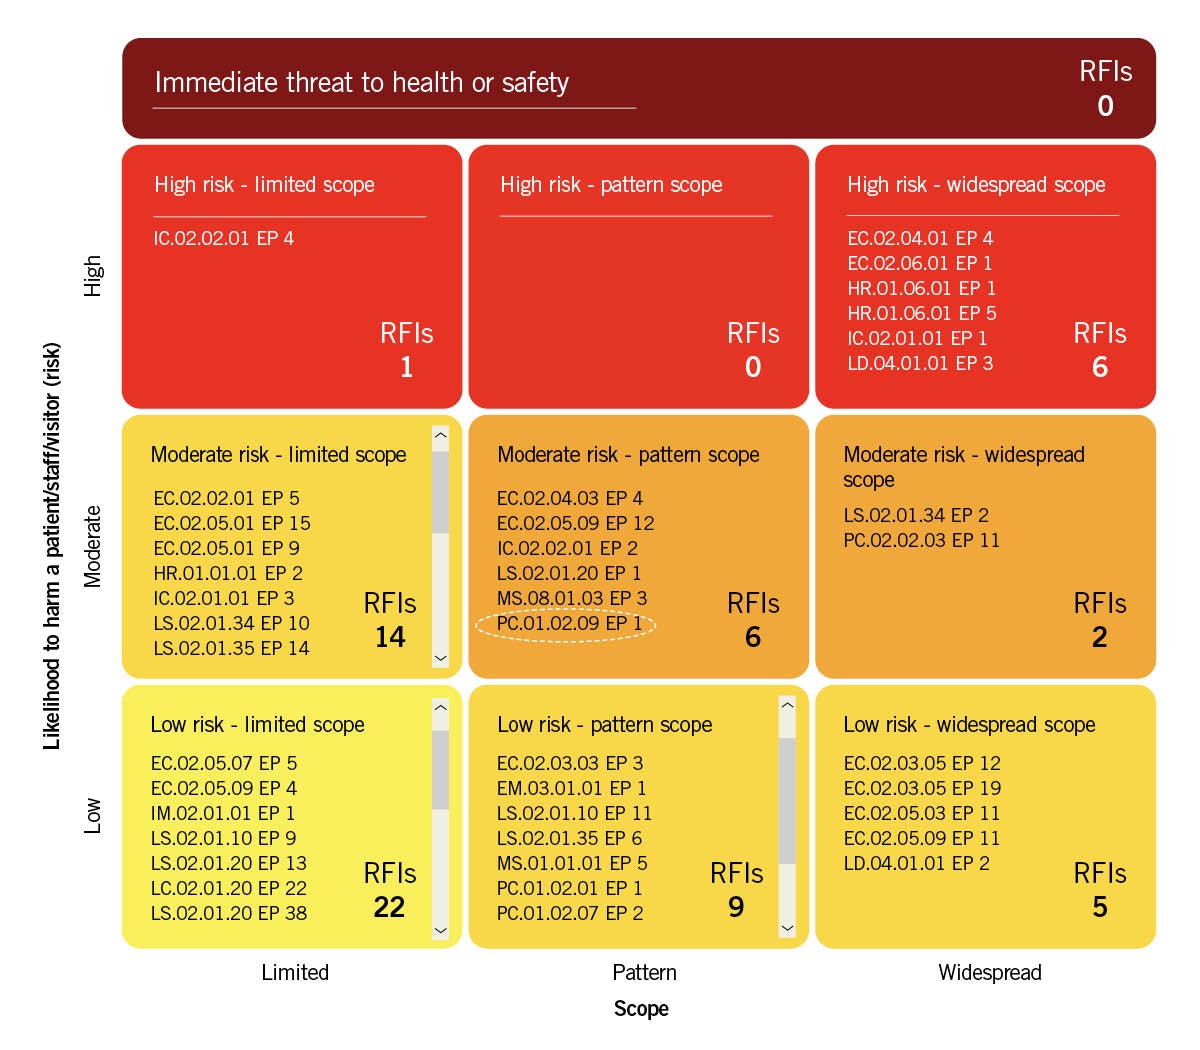
The SAFER matrix is designed to provide a more relevant assessment of the risk a survey observation carries. Sometimes, the description of an issue gives the spurious impression that it is relatively minor. However, the problem can lead to significant risks and serious implications for patients. The SAFER matrix provides a mechanism to help prioritize resources and focus corrective actions on areas that could have the most significant impact on patients (see figure on page 41).
While the concept of the SAFER matrix was well received by customers, the need to place all survey findings within a 10-box matrix heightened concerns about inconsistency. For this reason, as the SAFER matrix was tested and rolled out, TJC simultaneously implemented a new quality improvement program to address the fundamental challenge of scoring consistency as well as the new challenges created by the introduction of the SAFER matrix.
The document from which this article is excerpted describes the strategies TJC implemented over the last three years to improve scoring consistency and validity, and summarizes the major improvements that have resulted from these efforts.
Methods of measurement
To more closely study surveyor consistency, TJC mapped out methods of measurement and developed a tool to aid supervisor intervention. They include:
Measuring variation in SAFER scoring. To compare surveyor scoring patterns, survey findings from all full-survey events over a 12-month period are aggregated based upon their assignment to the 10-box SAFER matrix. A chi-square test is then used to compare the distribution of counts for each individual surveyor to the distribution of counts for their peer group. Each peer group is based upon the specific accreditation program and the surveyor role during the survey process.
So, the performance of an individual surveyor, who completed 25 full surveys within the ambulatory health care program as an engineer, would be compared to the distribution of findings for other engineers who were surveying ambulatory organizations during the same time period. TJC refers to the chi-square calculation as the “variation index.” It provides a numeric value for each individual surveyor (or more than one, if they surveyed multiple programs) where a score of zero indicates perfect alignment with the peer group and increasing values indicate greater variation from the peer group.
Given that surveyors are evaluating different organizations, it is assumed that all surveyors will differ from the peer group norm to some degree. Therefore, to aid in the interpretation of the variation index, and to prioritize supervision activities, the surveyor variation index values are converted into Z-scores. A Z-score of zero indicates that a surveyor’s variation is at the average for their peer group. Negative scores indicate that the surveyor’s variation is lower than average, whereas positive scores indicate that variation is higher than average.
To identify specific patterns of variation that can be used to guide discussions with individual surveyors, SAFER scoring is further broken down along each dimension of the SAFER matrix: “scope” (limited, pattern widespread or immediate threat to health or safety [ITHS]) and “likelihood to harm” (low, moderate, high or ITHS). Variation indices and Z-scores are calculated for both scope and risk in addition to the index for overall SAFER variation.
Measuring variation in survey domain scoring. TJC also assesses individual variation in survey domain scoring patterns. During the survey process, accreditation requirements are classified by various quality and safety domains (e.g., infection control, leadership, life safety code, medication management and patient care). To assess the degree to which surveyors and survey teams are consistently evaluating these domains, a similar process for calculating a variation index is applied.
In this case, the scoring patterns of individual surveyors (i.e., counts of survey findings within each quality and safety domain) are compared to the scoring patterns of their peer group for each accreditation program. Using this approach, it is possible to determine if an individual surveyor has a tendency to focus more intensively on certain topic areas and/or less intensively on others. On the domain scoring dimension, higher Z-scores indicate a greater degree of variation in the proportion of findings across domains relative to other surveyors.
Surveyor coaching tool. A data visualization tool was developed to give supervisors real-time data that can be used to illustrate performance differences and assist with coaching efforts. Throughout the development and testing process, the data visualization team met regularly with the supervisory staff of TJC’s surveyors. Feedback from these sessions were used to refine the application. By the end of 2017, the application referred to as the “surveyor coaching tool” evolved into a three-step process for visualization and coaching:
Step one. Provides supervisors with an annotated list of the surveyors using colored flags to draw attention to individual surveyors who are variation outliers in their scoring patterns.
Step two. Direct visual comparison of scoring patterns for an individual surveyor. This allows supervisors to assess the magnitude of differences when comparing an individual surveyor to their peer group. The same process is used to draw comparisons in SAFER matrix scoring.
Step three. Supervisors use the interactive features of the application to drill directly into the individual findings that led to the variation in scoring. Supervisors begin by comparing individual scoring patterns from surveyor to surveyor. By clicking on the chart, supervisors can see the actual survey findings rather than just the numbers; this allows them to conduct a direct inspection and draw conclusions about the cause of the variation.
Reducing inconsistency
As the surveyor coaching tool was formally introduced at the beginning of 2018, supervisors were instructed to focus on outliers. The coaching tool was their mechanism to visually identify outliers, rapidly determine the specific point of deviation for a surveyor and drill into their individual findings.
The ability to dig into the individual citations was an essential feature for a number of reasons. First, it allowed supervisors to engage their surveyors in discussions about what they were seeing and scoring, rather than focusing on statistics. Second, since SAFER scoring was new, supervisors were encouraged to keep an open mind about the nature of scoring discrepancies.
It was assumed that, in many cases, scoring variation may be justified. In other situations, discussions might lead to real-time education with a specific surveyor, or to the clarification of definitions that benefited the entire peer group.
In fact, the coaching process often took place while supervisors and supervisees shared computer screens over the phone so that the visual comparison of surveyor performance and the drilling into specific observations was collaborative. This practice tended to promote greater transparency and enhance trust. As supervisors gained experience with the tool, the outlier threshold was reduced to a Z-score of 2.5.
By mid-2019, the application was further enhanced so that supervisors could track the impact of their supervision efforts by monitoring changes in surveyor variation over time. And by the end of 2019, supervisors were using the coaching tool to assist with annual evaluations.
According to supervisors, efforts to address scoring inconsistencies tended to require different solutions, depending upon the nature of the underlying problem. These generally fell into one of three categories:
Individual coaching and education. In the simplest cases, a surveyor may have misinterpreted scoring guidelines, and brief education was sufficient to clarify and correct a problem.
Group education. In some cases, inconsistency between a surveyor and their peer group helped to identify a need for better education across the peer group.
Improving the clarity of standards and/or scoring guidance. The most challenging cases involve situations in which context could play a major role in SAFER scoring.
In response to these types of issues, TJC began to acquire a growing library of challenging scoring examples for standards that exhibited higher degrees of inconsistency. In many cases, the examples were reviewed by multiple experts who provided a rationale for SAFER placement recommendations.
Over time, collections of these examples were incorporated into educational efforts as tools that could be used to help guide placement in the SAFER matrix. During 2019, many of these examples were also being routinely added to the electronic scoring system that surveyors use during the survey process.
For example, the National Patient Safety Goal (NPSG) related to Suicide Prevention (NPSG 15.01.01) requires that organizations follow written policies and procedures addressing the care of patients at risk for suicide. At a minimum, these policies should include guidelines for reassessment and procedures monitoring patients who are at risk for suicide, and requirements for training and competency assessment of staff who care for patients at risk for suicide (Element of Performance 5).
During the survey process, as a surveyor begins to record a compliance issue related to this requirement, they are presented with several examples portraying varying levels of risk. The failure to reassess a high-risk suicide patient in accordance with the policy, or a situation in which a 1:1 monitor leaves a high-risk patient unattended in the bathroom, would be examples of “high” risk findings on the SAFER matrix. In contrast, a situation in which nurses responsible for completing suicide risk reassessments did not have evidence of training or competency assessment would be categorized as “moderate” risk.
These examples, which are frequently developed with input from experts, often include rationale statements to explain how the situational context and other factors justified placement at a specific risk level. The rationale statements are an important component, since it is not possible to create examples that cover every possible situation encountered by the survey team. Therefore, the rationale statements help to guide the systematic thought process needed to assess risk.
Results of study
The SAFER scoring system was introduced in 2017 and, by 2018, enough data had been collected to begin calculating the variation indices for most surveyors.
By mid-2018, supervisors were encouraged to use these data in regular supervision activities by using the surveyor coaching tool. This allowed TJC to assess the impact of these multifaceted efforts on surveyor consistency.
To quantitatively assess changes in surveyor consistency, surveyor Z-scores were compared between 2017 and 2019. To be included in the analysis, surveyors must have performed a minimum of five full survey events in both time periods.
Surveyors were then grouped into an intervention group (i.e., those surveyors identified as outliers in 2017, who became the focus of coaching and education efforts) and a control group (surveyors not identified as outliers in 2017, who received supervision as usual). Paired t-tests were used to compare the differences in the 2017 and 2019 Z-scores.
The comparison for SAFER scoring revealed that surveyors in the intervention group exhibited statistically significant improvement as compared to controls. This analytic approach was repeated to evaluate improvement in domain scoring. Surveyors in the intervention group improved significantly when compared to controls.
It is worth noting that, while coaching and education efforts appeared to have a positive impact on the surveyors identified as outliers in 2017, new outliers can be readily identified in the 2019 data. Achieving and maintaining high reliability is an ongoing process, not a one-time project. For this reason, new outliers are flagged on a quarterly basis so that supervisors may continue to redirect coaching efforts as new potential problems are identified.
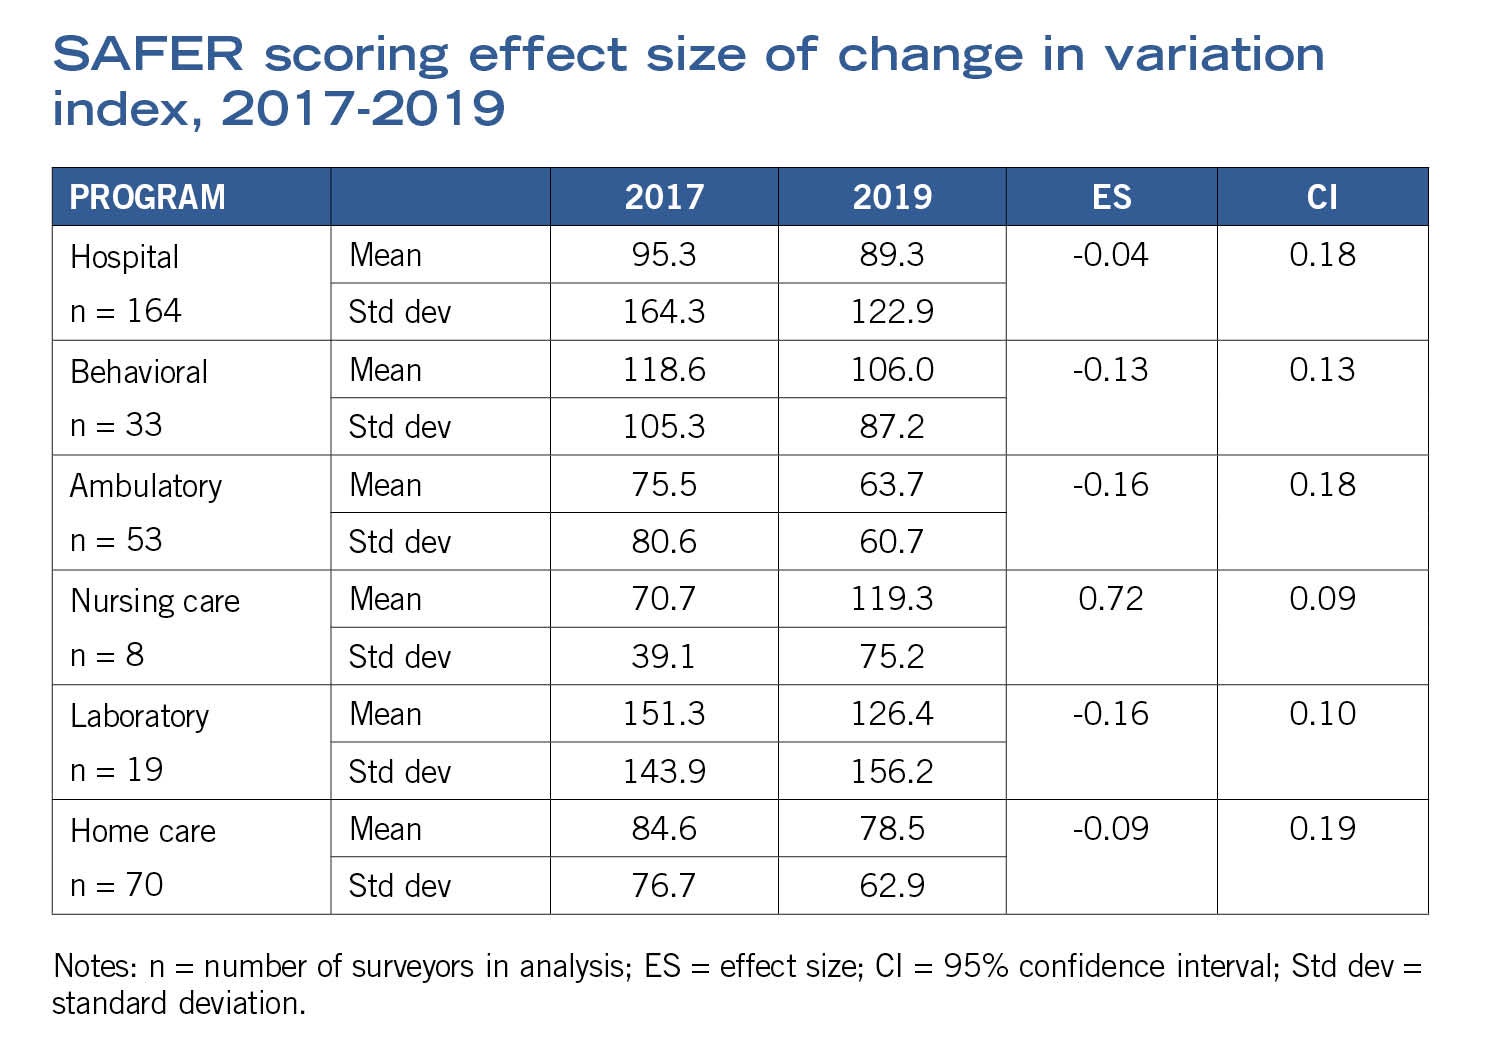
Finally, to compare the impact of improvement efforts at the accreditation program level, an effect size was calculated to assess change in the average SAFER variation index for all surveyors within the program area. Effect size was calculated for matched pairs using a repeated measures correction that is derived from a t-test of two correlated (paired) means corrected for the covariation of those means. The approach was selected because it provides a stable and moderate estimate of effect size when compared to many “raw” calculations of effect size (results are displayed in the table on this page).
Negative effect sizes represent improvement between the time periods, and improvement was observed for all accreditation programs except the nursing care program (which is difficult to interpret). While observed effects have been modest to date, interventions were initially focused on a small number of surveyors (outliers) and education efforts implemented in 2019 are likely to have more noticeable impacts in subsequent years.
A central strategy
Performance measurement with feedback, including benchmarking compared to peers, is a central strategy for quality improvement around the world. Just as TJC uses this methodology with its ORYX® measurement system and other measurement programs to help its accredited and certified organizations improve, TJC undertook this effort to do the same with its surveyors.
Specifically, TJC needed to ensure that surveyors have a consistent approach to how they assess the domains of safety for its standards and how they rate the likelihood to harm and scope of findings using the SAFER matrix. The tools TJC developed to identify surveyors with scoring patterns substantially different than their peers and provide them with concrete examples of improvement opportunities led to improved consistency for most of the surveyors identified as outliers.
The measurement system was not designed to systematically measure the validity or accuracy of surveyor scoring. However, the tools also allowed supervisors to assess the validity of surveyors’ scoring more easily; this sometimes identified surveyors whose scoring was rational and justified, and the examples from these surveyors were then used to set a standard for others to follow. In addition, TJC developed prototypes of commonly encountered deficiencies found on surveys and recommended SAFER scoring levels for likelihood to harm and scope.
TJC believes that other accrediting and certifying organizations are likely to have similar variations in scoring patterns.
Training alone is not enough, and direct observation by supervisors to provide feedback cannot substitute for comprehensive assessment of scoring patterns. Just as TJC is encouraging health care organizations to work toward high reliability, accrediting organizations need to do the same by routinely measuring surveyor variations and continuously working to improve.
About this article
This article is adapted with permission from a document by The Joint Commission, Improving the Consistency of Accreditation and Certification Scoring
Scott Williams, Psy.D., is director at the department of research, and David W. Baker, M.D., FACP, is executive vice president at the division of health care quality evaluation, at The Joint Commission. This article was adapted from a document they authored with help from Stephen Schmaltz, Ph.D., a biostatistician at The Joint Commission.
Related Articles

Why portable weapons detection units should not be the default approach
Factors to consider when evaluating portable versus permanent weapons detection systems for healthcare facilities.

NFPA approves weapons detection amendment
Plus: CMS clarifies condition-level noncompliance oversight; ASHRAE introduces new energy-saving requirement; CISA releases guidance on zero trust adoption for OT.

CMS data highlights opportunities to advance emergency preparedness
Here are the five most commonly cited emergency preparedness deficiencies at hospitals and tips on how to correct them.