
Air quality and infection prevention

Image by Getty Images
It is imperative for health facility engineers to fully understand and be able to explain how their building was designed and performs in areas of air pressure, temperature and humidity.
The right tools will help them communicate with clinical staff as well as engineering staff, so they may better understand the relationship between temperature and humidity as well as understand the features of the hospital.
Beaker illustration
Engineers have been using the same psychrometric chart since Willis H. Carrier invented it in 1904, and have struggled to convey the fundamentals to building occupants for more than 100 years.
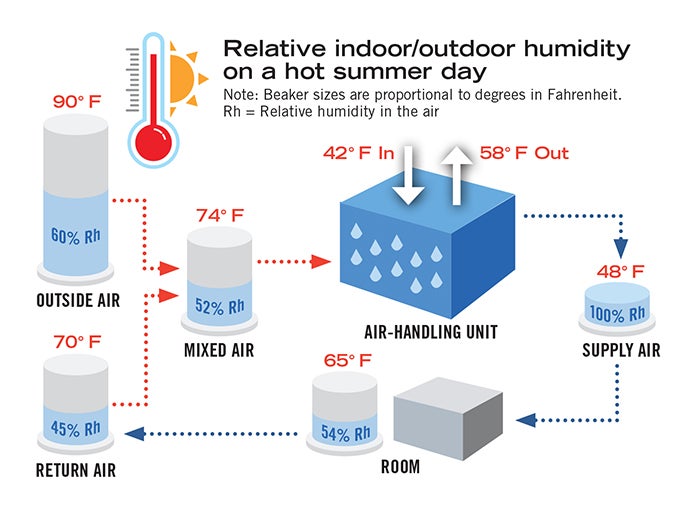
Image by Bill Payne
After many failed attempts, it was finally realized that it was much easier to explain psychrometrics and, more specifically, the relationship between temperature and humidity, by using 500 milliliter (ml) beakers. This is illustrated in a training video that can be accessed by American Society for Health Care Engineering (ASHE) members at www.ashe.org/temperature. The premise of using the beakers is to let 1 ml equal 1 grain per cubic foot and then calibrate amounts so that the moisture in the air at 90 degrees F will equal 500 ml. Now the height of the 500-ml beaker represents 100 percent humidity, or dewpoint, at 90 degrees F. A spreadsheet showing the calculations for a range of temperatures also can be found at the ASHE member link.
The concept of the beakers can be applied to how a typical HVAC system supplies air to the operating rooms (ORs) and can be explained by a simplified graphic (Page 45, upper right). While it should be noted that every hospital system is different and will perform differently than the example given here, the concepts are the same. The air that enters the system will contain a certain amount of humidity. As this air is cooled, the humidity level in the air will increase. If the humidity levels exceed the allowable amount in the air, there can be an increased risk of infections.

Being able to maintain the lowest possible temperature in the OR that does not cause the relative humidity to exceed 60 percent is important to be able to avoid this risk. Understanding that the driving factor of the relationship between the temperature being produced by the air handler and the humidity in the air helps the hospital engineer to properly operate the HVAC system.
Nine possible strategies
If conditions are not acceptable, there are steps that can be taken to improve the performance of an existing air-handling unit (AHU). The following strategies are ranked in order of estimated implementation cost, from least expensive to most expensive:
- Clean the cooling coil. The advantage of this strategy is its low cost.
- Calibrate the air-flow sensor to ensure that more outside air is not being brought in than is minimally required. This strategy saves energy and limits the amount of moisture brought into the AHU.
- Ensure that the chilled water temperature is a constant 42 degrees F (typically) because staging on and off chillers may cause spikes in the chilled-water temperature. Real-time monitoring and alarming of humidity levels in the ORs require near-constant water temperature and this will keep the humidity levels in the ORs constant. However, it may raise energy usage and may not be possible with some equipment and controls.
- Do not reset chilled-water temperature up to save energy. This provides the same advantages as Strategy 3, but it also will raise energy usage.
- Replace the preheating coil with a pre-cooling coil and then a double pipe coil to both with valves so they can be switched seasonally. A pre-cooling coil can lower the temperature of the mixed air without creating condensation on the coil, which allows the final coil to remove more moisture. However, the engineering staff must remember to change the valve positions and to switch the pre-coil from a heating coil to a cooling coil. Additionally, some AHUs use a steam coil for preheat.
- Replace the cooling coil with a thicker coil. A new coil will allow the discharge temperature to approach the chilled-
water temperature. However, a thicker coil requires more fan horsepower and the current fans may not be up to the task - Add a wrap-around coil to the current cool coil. A wrap-around coil removes heat from in front of the coil and discharges it past the coil. It is good to warm up the air as it leaves the cooling coil so the relative humidity will be lowered. However, it may be more difficult to clean the cooling coil in the future.
- Add a desiccant system to help reduce the moisture in the outside air before it enters the AHU. These systems can be very effective. However, the facility must have space to install the equipment and the ability to bring new utilities, such as steam, gas and electricity, to this new equipment.
- Replace a direct expansion (DX) AHU with a constant-temperature, chilled-water coil. DX technology has improved in recent years. However, keeping a constant coil temperature as the compressors stage on and off is challenging in all weather conditions. A DX unit was most likely the choice in the past because chilled water was not available. However, adding an air-cooled chiller can be expensive and may not fit on the roof.
Infection-prevention drawings
A facilities director would not think about operating his or her facility without a set of life-safety drawings. It is imperative that he or she fully understand the fire-safety features of the facility to be able to properly maintain them. It should also be considered that an infection-prevention set of drawings is just as important. This set of drawings is used to depict the critical pressure relationships within a health care facility. While most of this information is contained within the mechanical drawings for the facility — such as the information contained in the architectural plans for the life-safety features — it is spread throughout the construction documents and tends to be overly detailed.
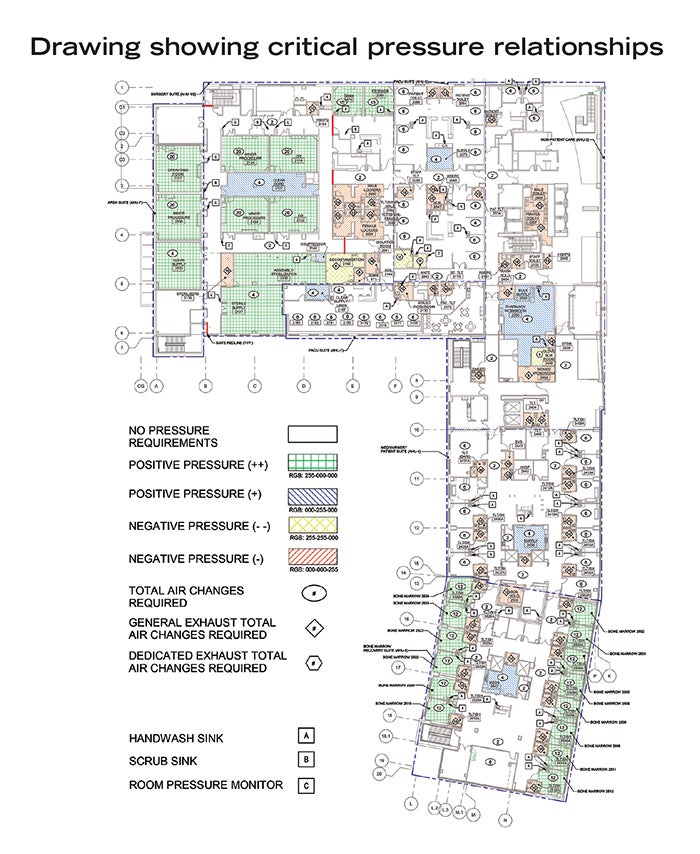
Image by Matthew Brewster of Leach Wallace Associates Inc.
In the example above, a color-coded system is used on the drawing to represent positive- and negative-pressure rooms as well as to indicate the air changes per hour in each critical space. This allows for a quick and easy reference guide for those needing to understand the infection-prevention measures used throughout the facility to help protect patients, staff and visitors.
This type of drawing not only can be used by the engineering staff to properly maintain the pressure relationships between areas, but also can be used to help clinical staff to understand these important relationships. Areas marked as critical positive or negative can be clearly designated for staff understanding and can be monitored in real time by the building automation system as well as local visual indicators and alarms.
Items marked as either positive or negative can be periodically tested by engineering. Other information such as the location of the “red line” separation and traffic patterns for soiled items, clean items and patients can be added as well.
The roof and the Facility Guidelines Institute’s 25-foot separation requirement also need to be considered. Where are the isolation exhaust, general exhaust, stack exhaust and air intakes?
Complex and sensitive
The relationship between temperature and humidity is an extremely complex and sensitive topic with which most health systems grapple daily. While the psychrometric chart is a powerful tool for assisting facility management staff and engineers in providing the appropriate temperature and humidity levels within their facilities, it can be difficult to justify daily decisions by trying to explain psychrometrics to clinical team members.
Clinicians and nurses don’t have time to pull out a psychrometric chart every time they become too cold or humid. When they become uncomfortable, they should be able to contact the engineering staff to address the issue. However, the one caveat is that they should have a basic understanding of how certain extreme temperature and humidity conditions affect the physical environment and impact patient safety.
The video demonstration, which took place in a typical OR setting, is a much easier way for facility management staff to highlight key points of temperature and humidity relationships to the physical environment. While viewers will not become experts at the end of the video, they should at least walk away with a basic understanding of the amount of moisture that ambient air can hold and how extreme changes in room temperature can potentially endanger patients.
Furthermore, they should also understand how operating spaces outside of compliance can jeopardize their organization’s accreditation status with the Centers for Medicare & Medicaid Services.
Facility engineers should work with senior leadership to incorporate the short video demonstration into other physical environment training materials available to clinicians. While this video tool is not a silver-bullet solution, it’s a useful aid that can educate those who are willing to listen.
In addition to the video, a set of infection-prevention drawings can assist in helping staff to understand the important pressure relationships throughout the facility, just as life-safety drawings have helped to reduce the risk of fire-safety hazards.
Bill Payne, CHFM, CFPS, SASHE, is associate vice president of facilities management at Wake Forest Baptist Medical Center, Winston Salem, N.C., and Ryan W. Ollie, CEM, CMVP, EIT, is manager of energy solutions at Advocate Aurora Health. They can be reached at wtpayne@wakehealth.edu and ryan.ollie@advocatehealth.com.
Related Articles
Operating and maintaining ventilation infrastructure
A preview of the ASHRAE/ASHE Guideline 43, Operations Guideline for Ventilation of Health Care Facilities.
NFPA weekly update: June 30 to July 4
The committee for NFPA 99, Health Care Facilities Code, makes progress on the second draft of the code’s 2027 edition.
NFPA weekly update: June 23-27
NFPA Technical Meeting voting results for the 2026 edition of NFPA 70, National Electrical Code, have been released.