
Architectural analysis
 Architecture and operations are inherently linked. What happens inside a building is influenced by space, and space is influenced by what goes on inside of it. This is especially important in health care architecture and design. Health care programmers, planners and designers have always regarded operations planning in some capacity during the architectural process — but how this is done has evolved.
In the past, programmers considered and researched the functions to occur in a space, and then drafted functional narratives. These narratives expressed to designers what programmers had come to understand through questionnaires, interviews and data requests about the operational intent and flow within a space (i.e., how it was supposed to operate) without much consideration about how it should be improved.
Recently, we've seen a shift toward lean operations planning, where operations is not only researched and understood, but also vetted with experts on operational best practices to eliminate and reduce waste in the process system. There are more opportunities in the future to improve operations before and with design through spreadsheet analysis and Lean Six Sigma simulation. Spreadsheet analysis allows testing of preferred basic operational parameters (e.g., hours of operation, room turnaround time, and target utilization rates).
Lean Six Sigma simulation allows stated process flows to be statistically analyzed with current and projected volume data, and throughput metrics. This exposes performance improvement opportunities and eliminates waste in a system and often has an impact on space. Spreadsheet analysis, a static model methodology, is a necessary baseline exercise and comparison model to Lean Six Sigma simulation, a dynamic model methodology. Below are three project examples where both spreadsheet analysis and/or Six Sigma simulation were used during pre-design to plan and improve operations performance in health care settings.
Case 1: Robert Wood Johnson University Hospital
Robert Wood Johnson University Hospital (RWJ), New Brunswick, N.J., recently completed focused Lean Six Sigma operations planning in concert with spreadsheet planning and lean facility planning in a large-scale process improvement and renovation/expansion project of its emergency department (ED). An initial step was developing future volume scenarios that considered opportunities and changes to the ED, both system- and community-wide. Then, ED operational processes were defined and refined, and then used to develop dynamic simulation models. These models were structured to evaluate various aspects of ED operations and delivery of care as well as facility configuration.
The quantitative volume data and qualitative process flow information built the baseline simulation models, which were used for comparison against performance improvement scenarios (from the refined process maps). Key performance indicators, such as patient throughput, length of stay (LOS) and total volume, were analyzed. Non-value-added activities were then identified across the adult and pediatric fast track, urgent and emergent areas of the ED. This statistical analysis of the current operational conditions exposed the waste in the system that would be negatively amplified in the future as additional volume is added. Important performance improvement opportunities identified in the system included reducing patient arrival-to-bed time, reducing physician specialist consult time, skipping triage, reducing boarding and admit order time, and creating a discharge lounge.
Additional future patient volume can be accommodated in the emergency department system, and "left without being treated" rates decreased by implementing these improvement opportunities and moderately redesigning the ED layout. The new layout options considered the above improvements, added a minimal number of strategically placed exam rooms, and divided the ED into zone-based care so that patients will flow through the ED according to their emergency severity index (ESI) designation. An urgent care facility, adjacent to the ED, was also considered in the development of options, as some volume and lower-ESI patients could be off-loaded to that facility. These changes, both operational and architectural, will maintain acceptable utilization rates, LOS times and other throughput measures.
To help achieve these improvements, a lean workout exercise was conducted to establish milestones and action tasks for implementing value propositions over 30, 60 and 90 days. Staffing was also analyzed to ensure all resources were properly utilized and placed in the new design. In this case, simulation and lean re-design helped uncover improvement opportunities and exposed the future rewards of implementation of the ED's proposed new layout and operational design.
Case 2: Orlando Regional Medical Center
In preparation for a $250 million expansion, Orlando (Fla.) Regional Medical Center (ORMC) conducted a twofold pre-design exercise with the intent to improve the operational efficiency of the expansion project's space program and design. HKS Architects focused on space programming and lean operations planning through static spreadsheet models, while Northern Lights developed dynamic Lean Six Sigma simulation models that validated and improved the static planning results.
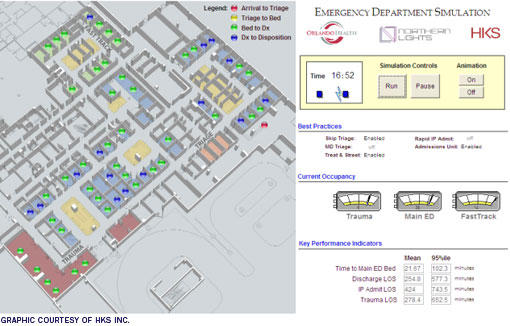 |
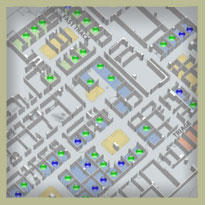
| In the ORMC project, the emergency department results were animated for visual review. This screen shot is of the model running with performance improvements at 16:42, or 4:42 in the afternoon. |
Simulation was conducted in four primary areas of the hospital: Inpatient, Surgery, Interventional Cardiology and Emergency. Models used FY2010 hospital data as a base for projections. Though built as separate departmental models, results of each were considered together.
The simulation process began with a current state assessment of operations, both quantitative and qualitative, to develop the baseline models. Data collected to build the simulation models included staff input on process flow maps, patient and process timestamps, and FY2010 volume data. Once the baseline models were created, future conditions could be tested and statistically analyzed with projected 2020 volumes to establish operational improvement opportunities and recommendations related to the expansion project program and design.
In addition to identifying process and capacity improvement opportunities, simulation of projected 2020 volumes provided guidance on a series of spatial and operational concerns for each area. The inpatient model tested preferred utilization targets for acute, intermediate and critical care (percentages tested were in the '70s and '80s), and percentage and number of beds in each acuity and service line. The surgery model tested the number of ORs and operating hours, as well as number of Pre-Op, PACU and Stage II recovery spaces. The interventional cardiology model tested the number of cath and EP labs and operating hours, and pre-op and recovery spaces. The emergency department tested the number of exam rooms by acuity as well as explored length of stay by acuity, room utilization and percent of patients at peak times.
The baseline simulation models gave a holistic and detailed look into the current state of the four departments, and exposed opportunities for improvement. The models were then stressed by additional volume (as projected to 2020) and further improvement opportunities were identified. Simulation models explored various existing conditions including discharge time of day, inpatient bed queuing and mapping, length of stay (inpatient, ED, etc.), arrival times, utilization thresholds (i.e., where the system breaks), average wait times, surgical case time starts, operating room turnaround time (TAT), procedure in-room time, boarding time, transport time, ED time to bed, ED left without being seen (LWBS) probability and ED acuity and disposition percentages.
Through comprehensive review of the hospital data, over four major departments, ORMC achieved a broad yet detailed understanding of their existing operational and process conditions. Eleven improvement opportunities were identified from the simulation modeling for ORMC as worth implementing due to their potential impact. Of the 11, seven were process changes and four were capacity enabling, each impacting multiple departments. The opportunities include skip triage, rapid inpatient intake, improve discharge time of day, reduce PACU recovery time, reduce Phase II recovery time, reduce Cath/EP patient in-room-time, reduce Cath/EP TAT, create inpatient discharge lounge, create inpatient admissions unit, reduce/eliminate OR boarding and reduce Cath/EP transport time.
Case 3: Miami Baptist Hospital ED
Miami (Fla.) Baptist Hospital wanted to improve its patient experience in its emergency to world-class levels through the design and construction of a new department informed by Six Sigma and simulation modeling. In this project, simulation was used exclusively. The Six Sigma project consisted of three transformational phases that used statistical tools, such as regression analysis, to pinpoint critical to quality (CTQ) processes in the supplier-input-output-customer (SIPOC) continuous flow. Rather than focus on external, difficult-to-predict "best practices," SIPOC uncovers internal, already-in-place best practices that can be replicated and optimized. Final inputs into the SIPOC enabled the ED leadership to view the ED through the "eyes of the inpatient nurse," adding further clarity to a very complex and unclear patient care continuum.
Another key component of Six Sigma projects is design of experiments (DOE), whereby the team plans and implements process improvements. Traditionally, organizations implement process improvements on varying levels of sophistication. At the lowest level, organizations "shoot from the hip" and implement what executives feel is the right thing to do. A more common approach is to implement best practices, assuming what works well for one hospital will work well for another. Those ideas that risked patient care were tested with simulation modeling. The simulation provided a quantitative comparison of process improvement ideas and showed hospital executives which ones likely will yield the most improvement. Experimental results indicated the following:
- Discharging inpatients about five hours earlier each day reduces ED patient LOS by a third;
- Adding 30 more inpatient beds will potentially cut the ED patient LOS in half;
- Doubling the transitional stay unit (TSU, a unit dedicated to admitting ED patients to inpatient status) size didn't significantly reduce ED patient LOS, but increasing the TSU to 50 reduced the ED patient LOS by a third;
- Reductions in lab test turnaround time didn't significantly affect overall patient LOS until it was reduced by at least 20 percent;
Also, despite increasing TSU and inpatient bed capacity, the simulation showed that the hospital will not meet its future goals for patient LOS. The Six Sigma teams must implement more profound process changes to reduce the patient LOS.
 |
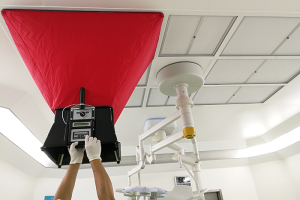
| A view of the completed Miami Baptist Hospital ED and inpatient tower addition. The design process was informed by the results of simulation and focused on improving the patient experience. |
The team tested reductions to the size of the proposed main ED design by a half-pod and a full pod. The simulation predicted no issues with patient throughput at baseline volumes. ED and observation/TSU utilization did increase, but not enough to cause problems. The simulation predicted the new ED could handle 115,000 annual visits with no change in performance. At 120,000, the inpatient beds start to "stress" at in the high 90 percent utilization range and cause increased wait times for an inpatient bed.
At 120,000 visits, time in ED bed goes up by more than 40 percent over baseline and the ED rooms are doubled up 10 percent of the time. At 125,000 visits, the system breaks because there aren't enough inpatient beds, thus backing up patients in the ED. There is an extremely rapid degradation in performance from 120,000 to 125,000 visits.
Finally, based on Six Sigma simulation modeling, the final ED design was able to provide area reductions of approximately 18,000 square feet. Then, using the unit construction cost per square foot in the previously generated capital cost models, the reduction to the construction cost was approximately $4 million.
Great deal of insight
Simulation provided a great deal of insight for each of these cases. One of the profound discoveries in the RWJ project was the operations improvement opportunity of skipping triage in the ED.
In the ORMC case, it was found that by shifting 50 percent of discharges to two hours earlier and creating a discharge lounge, the inpatient system could handle additional volume more effectively. Simulation at ORMC also allowed testing of patient bed queuing and utilization rates. By assigning primary and secondary patient unit mapping preferences, the simulation model showed utilization rates by unit, and when the individual units utilization rates exceeded the threshold that broke the entire system.
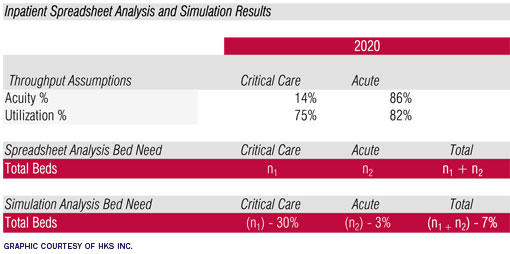 |
| This diagram shows the difference in inpatient results of spreadsheet analysis and simulation at ORMC, which helped validate and facilitate a conversation with the owners about their preference on how much performance improvement they foresaw implementing and achieving. |
For Miami Baptist, the simulation results enabled a downsizing of the final ED, resulting in significant reduction in capital cost. It is also important to note that scheduling simulation projects with lead time is critical — acquiring and analyzing data can be time-consuming and a realistic schedule is necessary for successful project results.
Operations planning is a discovery process, and both spreadsheet analysis and Lean Six Sigma simulation are valuable exercises within it. These static and dynamic modeling methodologies, when used in concert, inform and validate one another. Spreadsheet analysis should be the minimum for operations planning, and Lean Six Sigma simulation should not be conducted without the context of spreadsheet analysis. But, simulation is not always necessary.
Simulation is suited for very complex systems (i.e., emergency departments, inpatient systems with multiple service lines and acuity). It is also appropriate for systems expecting stress from additional volume. Simulation provides a greater degree of detail and tests more variables than spreadsheet analysis — exposing improvement opportunities in processes. Results of simulation give insight into how facilities can enable capacity and reduce spatial needs through process improvement.
Operations planning methodologies in architecture have come a long way. Spreadsheet analysis and Lean Six Sigma simulation are providing deeper review of operations processes and leading to leaner architectural designs. These exercises are requiring greater effort than the programming narratives of the past, but are affording clients and architects stronger operational understanding and spatial response in design.
Frank D. Kittredge, Jr., FACHE, is associate principal/senior vice president and director of HKS Clinical Solutions & Research; Ashley N. Dias, LEEP AP, EDAC, is operations/facility planner at HKS Inc.; and Martin J. Miller is senior manager at Northern Lights Systems Navigation LLC, Phoenix. They can be reached at fkittredge@hksinc.com, adias@hksinc.com and mmiller@northernlightsnav.com, respectively.
Related Articles
Preventing a possible outbreak through emergency response and remediation
Lessons learned from a real-life hospital flooding scenario and six steps for response.
Five things to include in a physical environment mitigation plan
A quick guide on how to identify and address physical environment issues quickly and effectively.
The facilities manager’s role in reducing healthcare-associated infections
From multidisciplinary communication to establishing safety procedures for construction, remediation and maintenance, facilities teams play a critical hand in reducing patient infections.